
Every autumn, secondary school leaders in England pore over the same questions. How did our GCSE results compare? How did our disadvantaged pupils do against disadvantaged pupils elsewhere? Which subjects are flying and which need a closer look? The official answers arrive in Ofsted’s Inspection Data Summary Report (IDSR) and the DfE’s performance tables, but they’re spread across several places and not always easy to explore. So I built KS4 Benchmark: a free website where you can look up any secondary school in England and see its results against similar schools, its trust, its local authority, its region and the country.
What it does
Type a school’s name, town or URN into the search box and you get a set of views, each one a question a head of department or senior leader might ask:
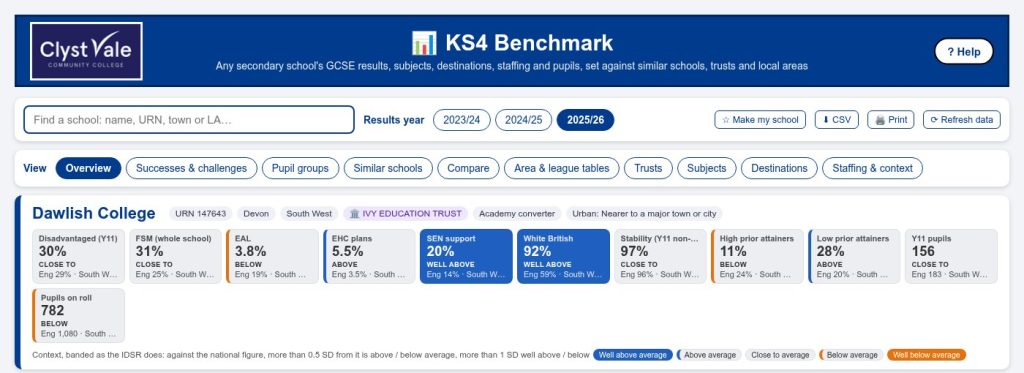
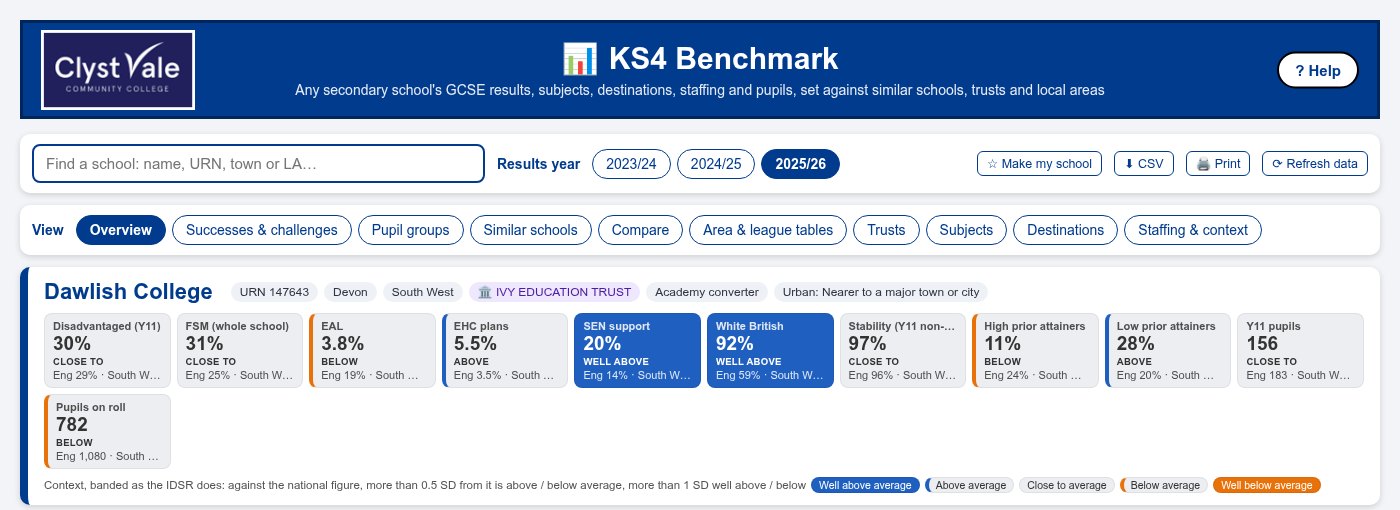
- Overview: the headline measures (Attainment 8, Progress 8 where it’s published, English and maths at grades 4, 5 and 7, disadvantaged pupils’ results) set against England, the region, the local authority and the trust.
- Successes and challenges: the findings sorted into “build on” and “investigate”, with a few review questions to start a conversation.
- Pupil groups: disadvantaged, boys, girls, EAL and more, each compared with the same group of pupils nationally, which is a much fairer comparison than the school’s overall average.
- Subjects: how each GCSE subject did, and where it ranks.
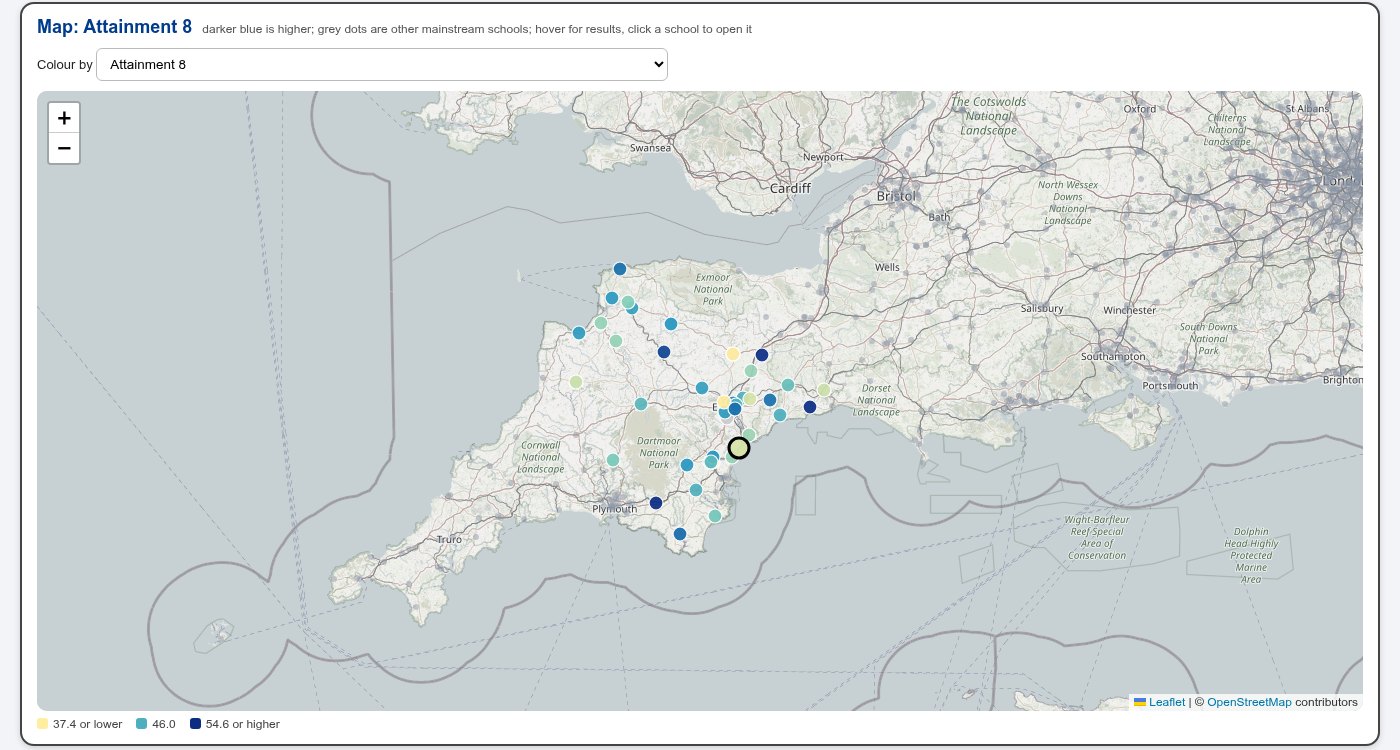
- Area and league tables: every mainstream school in a local authority or region as a sortable table, a chart of any two measures, or a map.
- Trusts, Destinations (where pupils went after Year 11) and Staffing and context (pupil-teacher ratios, staff absence, attendance, suspensions and the make-up of the school).
Working like the IDSR
The one rule I set from the start was that the site should work things out the way the IDSR does wherever the public data allows, so the numbers you see line up with the ones in an inspection pack. That sounds simple, but the details matter. For example, a national “benchmark” is the rate across all state-funded schools added together, not the average of each school’s figure. Context measures are banded by how far they sit from the national figure, so you get the same “above”, “close to” and “below” wording. Where the site can’t follow the IDSR exactly, because some of the data isn’t public, the Help page has a Methods section that lists every difference.
All the data is public. GCSE results, subjects and destinations come live from the DfE’s own statistics API, and the school details (trust, type, location) come from Get Information About Schools. There’s no login and nothing to install, and you can download any table as a CSV or print it.
The tricky bit: similar schools
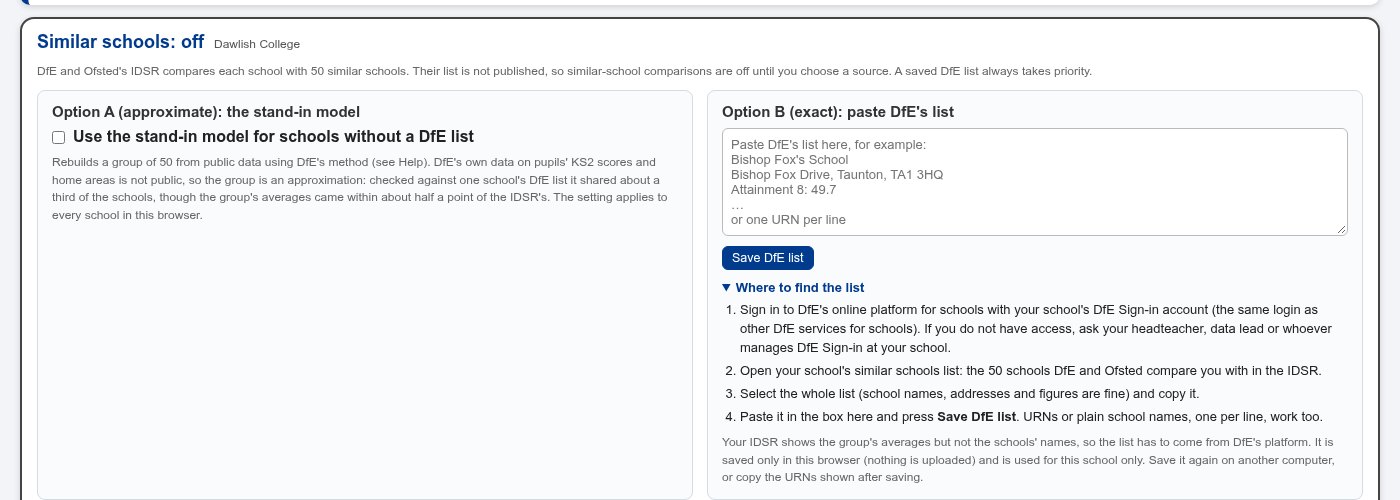
The IDSR compares each school with a group of about 50 “similar schools”. Ofsted shows the group’s averages, but not which schools are in it. I spent a good while rebuilding the DfE’s similar-schools model from its published method, and got the group averages to within about half a grade point. But some of the ingredients, such as the prior attainment of pupils lower down the school, simply aren’t public, so a rebuilt group only ever overlaps partly with the real one.
In the end the honest answer was to leave similar schools off unless you choose a source. Schools can paste their own list from the DfE’s sign-in service, which is exact and stays in their browser, or switch on the stand-in model knowing it’s an approximation.
How it came together
Like my other recent projects, I built this with an AI coding assistant over a few evenings. The pattern that worked was the same each time: describe what a real user (usually me, or a colleague) needs to see; get a first version working quickly; then check the numbers against a source I trust. Here that meant putting the site’s figures next to a real IDSR and chasing every difference until it either matched or had a clear, written-down reason. That checking changed the site more than once, and it’s why similar schools ended up switched off by default.
It also taught me something worth passing on to students: be honest about what your data can and can’t tell you. A confident-looking number that’s quietly wrong is worse than a clear note saying “this bit is an estimate”.
KS4 Benchmark was inspired by KS4 Compare by C Payne, which is well worth a look too. It’s an independent tool, not a DfE or Ofsted service. If you work in a school and try it, I’d love to hear what you’d add. Leave a comment below.